Artemis 提供一些基於 JMS 2 API 的內建效能測試工具,以協助使用者 (和開發人員) 在不同情境下壓力測試已設定的 Artemis 代理程式執行個體。
這些命令列工具不代表完整的基準測試 (例如 Open Messaging),但可以用作產生基準測試的建構區塊。它們本身也相當實用。
總而言之,所提供的 perf 工具如下
-
producer工具:它可以使用已設定大小的 BytesMessage,產生全力輸送量或目標速率負載 -
consumer工具:它使用 MessageListener 來取用producer命令傳送的訊息 -
client工具:它將這兩種工具包裝成單一命令
大多數使用者只需要 client 工具,但 producer 和 consumer 工具允許在其他情境下執行測試
-
延遲消費者啟動,以導致代理程式分頁
-
在不同的機器上執行生產者和消費者
-
…
以下範例 (在 64 位元 Linux 5.14,配備 Intel® Core™ i7-9850H CPU @ 2.60GHz × 12,已停用 Turbo Boost、32 GB RAM 和 SSD 上執行) 顯示不同複雜程度的使用案例。隨著進展,將會探討工具的一些內部架構詳細資訊和支援的設定選項。
|
這些工具可以從代理程式的執行個體資料夾或主資料夾中執行。在這兩種情況下,使用者都應設定 |
1. 情境 1:單一生產者透過佇列傳送訊息給單一消費者
讓我們看看輸入後會發生什麼事
$ ./artemis perf client queue://TEST_QUEUE
Connection brokerURL = tcp://127.0.0.1:61616
2022-01-18 10:30:54,535 WARN  [org.apache.activemq.artemis.core.client] AMQ212053: CompletionListener/SendAcknowledgementHandler used with confirmationWindowSize=-1. Enable confirmationWindowSize to receive acks from server!
--- warmup false
--- sent:          7316 msg/sec
--- blocked:       6632 msg/sec
--- completed:     7320 msg/sec
--- received:      7317 msg/sec
# ...
測試會持續執行,直到將 SIGTERM 或 SIGINT 訊號傳送到 Java 程序 (在 Linux 主控台上,這表示按下 CTRL + C)。在了解這些指標的意義之前,有一個不應忽略的初始 WARN 記錄
WARN [org.apache.activemq.artemis.core.client] AMQ212053: CompletionListener/SendAcknowledgementHandler used with confirmationWindowSize=-1. Enable confirmationWindowSize to receive acks from server!它顯示了兩件事
-
負載產生器使用 非同步訊息生產者
-
confirmationWindowSize是 Artemis CORE 通訊協定特定的設定;perf命令使用 CORE 作為預設 JMS 提供者
1.1. 即時延遲主控台回報
perf client 命令可以透過將 --show-latency 新增至命令引數,在主控台上回報不同的延遲百分位數指標,但為了取得有意義的指標,我們需要透過在生產者 url 上設定 confirmationWindowSize 來解決 WARN 問題,並設定 --consumer-url 來儲存消費者相同的設定。
簡而言之,此命令會使用這些額外參數
--show-latency --url tcp://127.0.0.1:61616?confirmationWindowSize=20000 --consumer-url tcp://127.0.0.1:616161.1.1. 執行
$ ./artemis perf client --show-latency --url tcp://127.0.0.1:61616?confirmationWindowSize=20000 --consumer-url tcp://127.0.0.1:61616 queue://TEST_QUEUE
--- warmup false
--- sent:          8114 msg/sec
--- blocked:       8114 msg/sec
--- completed:     8114 msg/sec
--- received:      8113 msg/sec
--- send ack time:   mean:    113.01 us - 50.00%:    106.00 us - 90.00%:    142.00 us - 99.00%:    204.00 us - 99.90%:    371.00 us - 99.99%:   3455.00 us - max:      3455.00 us
--- transfer time:   mean:    213.71 us - 50.00%:    126.00 us - 90.00%:    177.00 us - 99.00%:   3439.00 us - 99.90%:   7967.00 us - 99.99%:   8895.00 us - max:      8895.00 us
# CTRL + C pressed
--- SUMMARY
--- result:              success
--- total sent:            70194
--- total blocked:         70194
--- total completed:       70194
--- total received:        70194
--- aggregated send time:       mean:    101.53 us - 50.00%:     86.00 us - 90.00%:    140.00 us - 99.00%:    283.00 us - 99.90%:    591.00 us - 99.99%:   2007.00 us - max:     24959.00 us
--- aggregated transfer time:   mean:    127.48 us - 50.00%:     97.00 us - 90.00%:    166.00 us - 99.00%:    449.00 us - 99.90%:   4671.00 us - 99.99%:   8255.00 us - max:     27263.00 us
一些注意事項
-
WARN訊息現在已消失 -
傳送確認時間和傳輸時間統計資料會以秒為間隔列印 -
總計和彙總指標會在測試完成時列印 (稍後會詳細說明)
即時延遲統計資料的意義如下
- 傳送確認時間
-
確認傳送訊息的延遲百分位數
- 傳輸時間
-
將訊息從生產者傳輸到消費者的延遲百分位數
perf 命令使用 JMS 2 非同步訊息生產者,讓負載產生器可以累積處理中的傳送訊息,並且根據通訊協定實作,可能會因為生產者流程控制而封鎖其生產者執行緒。例如:Artemis CORE 通訊協定可以封鎖生產者執行緒,以重新填補生產者額度,而 QPID-JMS 則不會。
perf 工具會實作其本身處理中傳送的要求追蹤,而且可以設定為限制未決傳送訊息的數量,同時回報生產者因為等待完成而「封鎖」的速率
|
生產者執行緒是否
封鎖?雖然負載背壓機制是非封鎖的,但由於負載產生器在被通訊協定用戶端背壓時無法進一步推送負載,因此負載在語義上會「封鎖」。此詳細資料與說明主控台上的即時速率 統計資料有關 |
預設情況下,perf 工具 (即:client 和 producer) 將處理中的要求數量限制為 1:若要變更預設設定,使用者應新增 --max-pending 參數設定。
|
設定 不建議這樣做! |
更多關於指標的詳細資料
- 預熱
-
收集統計資料範例時的產生器階段;預熱持續時間可以透過設定
--warmup來設定 - 傳送
-
訊息傳送速率
- 已封鎖
-
嘗試傳送新訊息的速率,「封鎖」等待
--max-pending重新填補 - 已完成
-
生產者收到訊息傳送確認的速率
- 已接收
-
消費者收到訊息的速率
1.2. 如何解讀即時統計資料?
+ 大量的 已封鎖 與 已傳送 比較表示代理程式不夠快,無法在傳送新訊息之前重新填補單一 --max-pending 配額。+ 可以變更為
--max-pending 100$ ./artemis perf client --warmup 20 --max-pending 100 --show-latency --url tcp://127.0.0.1:61616?confirmationWindowSize=20000 --consumer-url tcp://127.0.0.1:61616 queue://TEST_QUEUE
Connection brokerURL = tcp://127.0.0.1:61616?confirmationWindowSize=20000
# first samples shows very BAD performance because client JVM is still warming up
--- warmup true
--- sent: 27366 msg/sec
--- blocked: 361 msg/sec
--- completed: 27305 msg/sec
--- received: 26195 msg/sec
--- send ack time: mean: 1743.39 us - 50.00%: 1551.00 us - 90.00%: 3119.00 us - 99.00%: 5215.00 us - 99.90%: 8575.00 us - 99.99%: 8703.00 us - max: 23679.00 us
--- transfer time: mean: 11860.32 us - 50.00%: 11583.00 us - 90.00%: 18559.00 us - 99.00%: 24319.00 us - 99.90%: 31359.00 us - 99.99%: 31615.00 us - max: 31615.00 us
# ... > 20 seconds later ...
# performance is now way better then during warmup
--- warmup false
--- sent: 86525 msg/sec
--- blocked: 5734 msg/sec
--- completed: 86525 msg/sec
--- received: 86556 msg/sec
--- send ack time: mean: 1109.13 us - 50.00%: 1103.00 us - 90.00%: 1447.00 us - 99.00%: 1687.00 us - 99.90%: 5791.00 us - 99.99%: 5983.00 us - max: 5983.00 us
--- transfer time: mean: 4662.94 us - 50.00%: 1679.00 us - 90.00%: 12159.00 us - 99.00%: 14079.00 us - 99.90%: 14527.00 us - 99.99%: 14783.00 us - max: 14783.00 us
# CTRL + C
--- SUMMARY
--- result: success
--- total sent: 3450389
--- total blocked: 168863
--- total completed: 3450389
--- total received: 3450389
--- aggregated send time:       mean:   1056.09 us - 50.00%:   1003.00 us - 90.00%:   1423.00 us - 99.00%:   1639.00 us - 99.90%:   4287.00 us - 99.99%:   7103.00 us - max:     19583.00 us
--- aggregated transfer time: mean: 18647.51 us - 50.00%: 10751.00 us - 90.00%: 54271.00 us - 99.00%: 84991.00 us - 99.90%: 90111.00 us - 99.99%: 93183.00 us - max: 94207.00 us關於結果的一些注意事項
-
我們現在有合理的
已封鎖/已傳送比率 (< ~10%) -
與先前的結果相比,傳送速率提高了 十倍
以及 SUMMARY 統計資料
-
總計計數器包含使用warmup true收集的測量值 -
彙總延遲不包含使用warmup true收集的測量值
1.3. 如何比較不同測試之間的延遲?
主控台輸出格式並非設計為方便比較延遲,但 perf 命令會公開 --hdr <hdr 檔案名稱> 參數來產生 HDR 直方圖相容的報告,可以使用不同的視覺化工具開啟,例如:線上 HdrHistogram 記錄分析器、HdrHistogramVisualizer 或 HistogramLogAnalyzer。
| 本指南中收集的任何延遲追蹤都會使用 線上 HdrHistogram 記錄分析器作為 HDR 直方圖視覺化工具。 |
以下是新增至先前基準測試時所收集的 HDR 直方圖視覺化
--hdr /tmp/non_durable_queue.hdr整個測試執行顯示已標記的延遲,以區分 預熱延遲
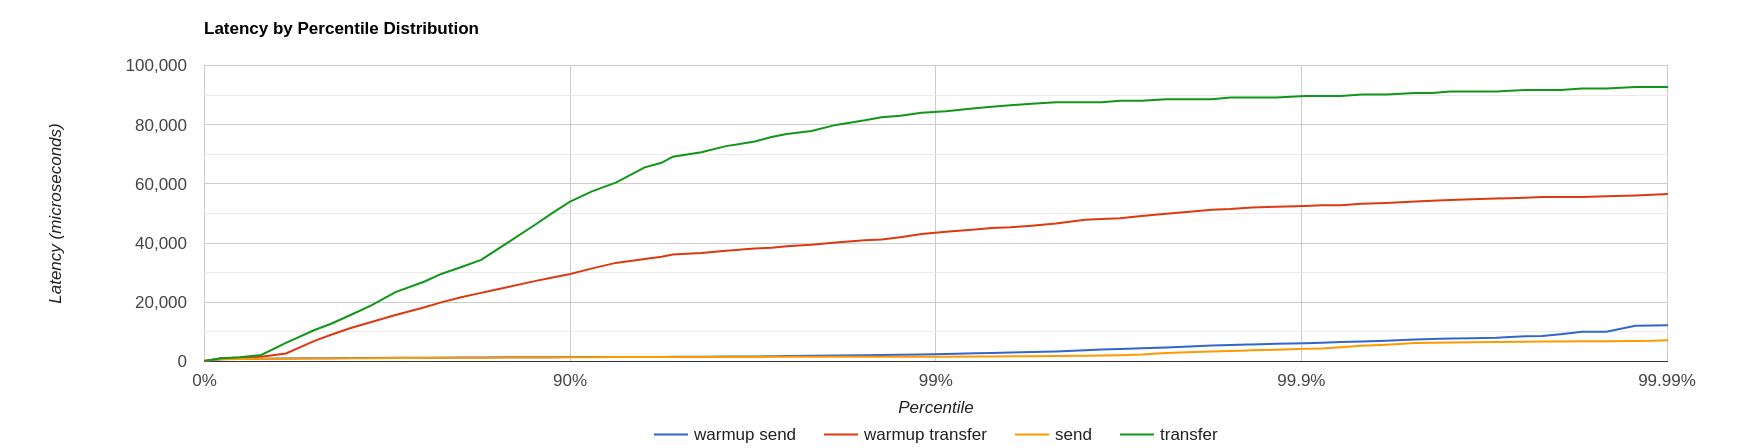
篩選掉 預熱 延遲,看起來像
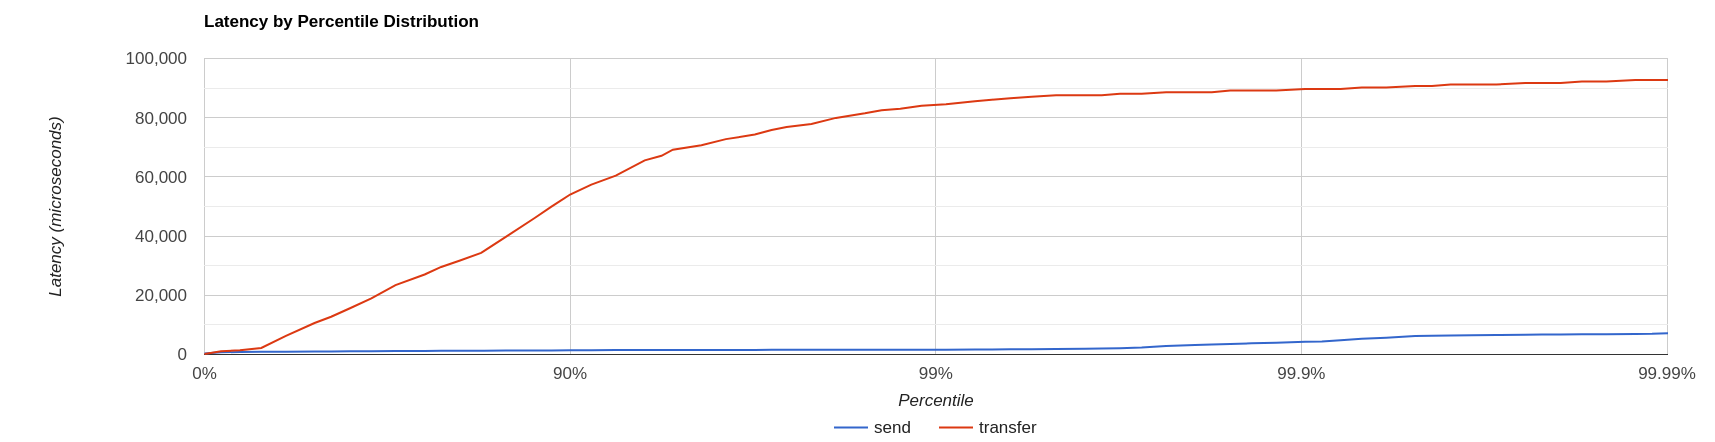
延遲結果顯示,在較高的百分位數中,傳輸 延遲遠高於 傳送 延遲 (提醒:傳送 是確認傳送訊息的時間),這可能表示代理程式上發生了一些排隊。
為了測試此理論,我們切換到目標速率測試。
2. 情境 2:目標速率的單一生產者透過佇列傳送訊息給單一消費者
perf client 和 perf producer 工具允許指定目標速率來排程生產者要求:新增
--rate <msg/sec integer value>先前的範例上次執行顯示,--max-pending 100 保證已彙總延遲的已封鎖/已傳送訊息 < 10%
--- aggregated send time: mean: 1056.09 us - 50.00%: 1003.00 us - 90.00%: 1423.00 us - 99.00%: 1639.00 us - 99.90%: 4287.00 us - 99.99%: 7103.00 us - max: 19583.00 us
--- aggregated transfer time: mean: 18647.51 us - 50.00%: 10751.00 us - 90.00%: 54271.00 us - 99.00%: 84991.00 us - 99.90%: 90111.00 us - 99.99%: 93183.00 us - max: 94207.00 us我們希望將 傳輸時間 降低到毫秒以下;讓我們嘗試執行負載測試,其傳送速率約為最大感知傳送速率的 30%,方法是設定
--rate 30000 --hdr /tmp/30K.hdr然後整個命令為
$ ./artemis perf client --rate 30000 --hdr /tmp/30K.hdr --warmup 20 --max-pending 100 --show-latency --url tcp://127.0.0.1:61616?confirmationWindowSize=20000 --consumer-url tcp://127.0.0.1:61616 queue://TEST_QUEUE
# ... after 20 warmup seconds ...
--- warmup false
--- sent:         30302 msg/sec
--- blocked:          0 msg/sec
--- completed:    30302 msg/sec
--- received:     30303 msg/sec
--- send delay time: mean:     24.20 us - 50.00%:     21.00 us - 90.00%:     54.00 us - 99.00%:     72.00 us - 99.90%:    233.00 us - 99.99%:    659.00 us - max:       731.00 us
--- send ack time:   mean:    150.48 us - 50.00%:    120.00 us - 90.00%:    172.00 us - 99.00%:   1223.00 us - 99.90%:   2543.00 us - 99.99%:   3183.00 us - max:      3247.00 us
--- transfer time:   mean:    171.53 us - 50.00%:    135.00 us - 90.00%:    194.00 us - 99.00%:   1407.00 us - 99.90%:   2607.00 us - 99.99%:   3151.00 us - max:      3183.00 us
# CTRL + C
--- SUMMARY
--- result:              success
--- total sent:          1216053
--- total blocked:           845
--- total completed:     1216053
--- total received:      1216053
--- aggregated delay send time: mean:     35.84 us - 50.00%:     20.00 us - 90.00%:     55.00 us - 99.00%:    116.00 us - 99.90%:   3359.00 us - 99.99%:   5503.00 us - max:      6495.00 us
--- aggregated send time:       mean:    147.38 us - 50.00%:    117.00 us - 90.00%:    165.00 us - 99.00%:    991.00 us - 99.90%:   4191.00 us - 99.99%:   5695.00 us - max:      7103.00 us
--- aggregated transfer time:   mean:    178.48 us - 50.00%:    134.00 us - 90.00%:    188.00 us - 99.00%:   1359.00 us - 99.90%:   5471.00 us - 99.99%:   8831.00 us - max:     12799.00 us
我們現在已達到 90.00 百分位數之前的毫秒以下 傳輸 延遲。+ 開啟 /tmp/30K.hdr 可更容易看到它
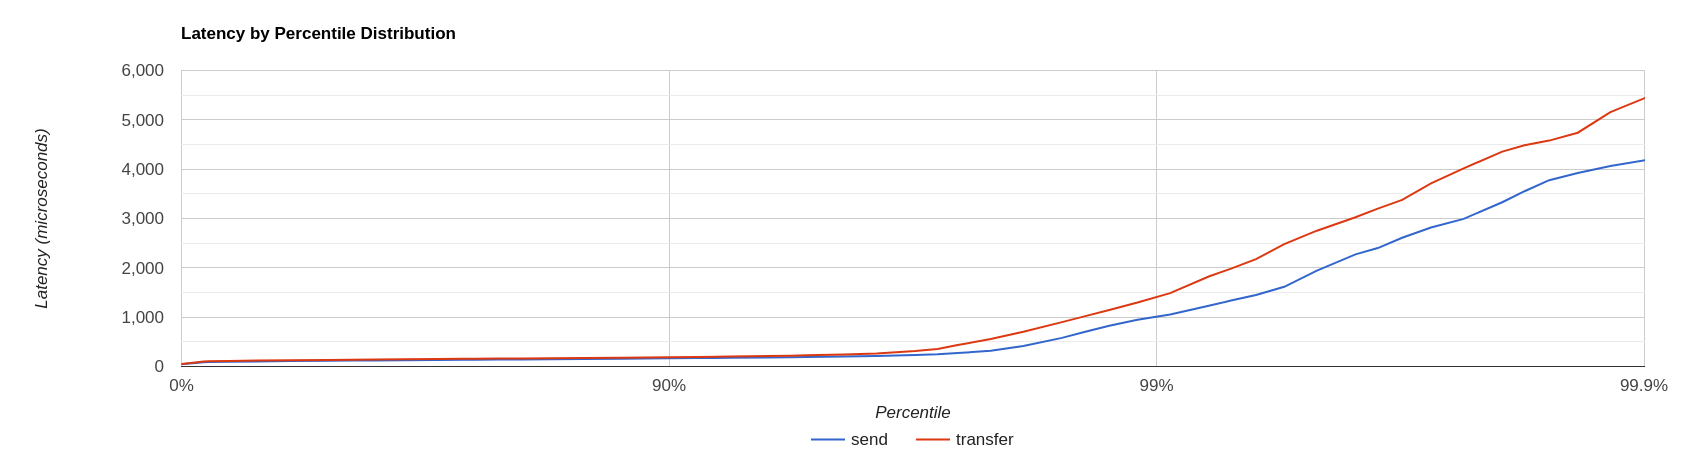
現在 傳送 和 傳輸 時間看起來非常相似,而且沒有排隊的跡象,但是…
2.1. 延遲傳送時間 的意義?
此指標是從 協調省略概念借用而來,它測量生產者以要求速率嘗試傳送訊息時的延遲。
此延遲的來源可能是
-
回應緩慢的代理程式:負載產生器已達到
--max-pending,而且無法達成預期的速率 -
用戶端資源耗盡 (缺少 CPU 時間、GC 暫停等):負載產生器無法趕上預期的速率,因為對它來說「太快」了
-
通訊協定相依的封鎖行為:CORE JMS 2 非同步傳送可能會因為
producerWindowSize耗盡而封鎖
目標速率測試的健全執行應將 延遲傳送時間 控制在範圍內,否則必須採取調查動作來了解延遲的來源。+ 讓我們用一個範例來說明:我們已經檢查過代理程式的全速速率,即 ~90K msg/秒
在相同條件下執行 --rate 90000 測試,延遲將會如下所示
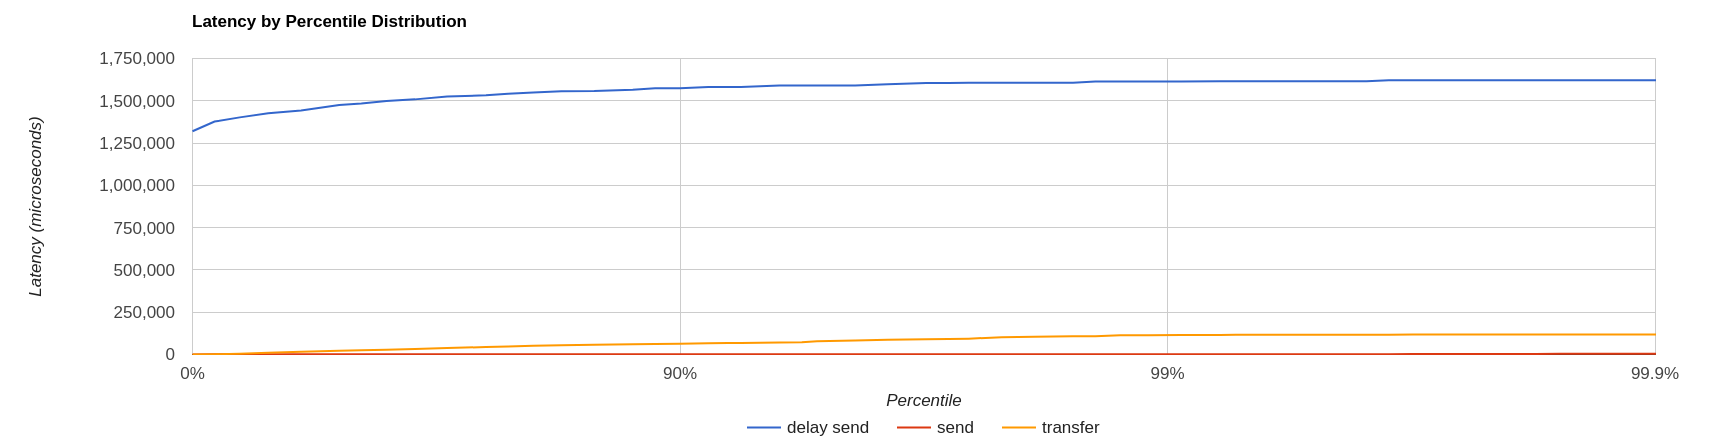
它清楚地顯示負載產生器正在延遲,而且無法趕上預期的速率。
以下是一個更複雜的範例,其中包含目的地 (自動) 產生,以及「不對稱」負載,即:生產者數量與消費者數量不同。
3. 情境 3:目標速率負載於 10 個持久主題,每個主題有 3 個生產者和 2 個非共享消費者
perf 工具可以使用下列項目自動產生目的地
--num-destinations <number of destinations to generate>並使用指定為種子的目的地名稱和排序序列後綴來命名它們。
例如
--num-destinations 3 topic://TOPIC會產生 3 個主題:TOPIC0、TOPIC1、TOPIC2。
使用預設組態(不指定 --num-destinations)時,只會建立名為 TOPIC 的主題,而不會有任何數字後綴。
為了在 10 個主題上產生負載,**每個**主題都具有 3 個生產者和 2 個非共享的消費者,
--producers 3 --consumers 2 --num-destinations 10 topic://TOPIC完整的 perf client 全力輸送量指令會是:
# same as in the previous cases
./artemis perf client --warmup 20 --max-pending 100 --s
how-latency --url tcp://127.0.0.1:61616?confirmationWindowSize=20000 --consumer-url tcp://127.0.0.1:61616 \
--producers 3 --consumers 2 --num-destinations 10 --durable --persistent topic://DURABLE_TOPIC
# this last part above is new它將會印出…
javax.jms.IllegalStateException: Cannot create durable subscription - client ID has not been set鑒於產生器正在建立非共享的持久主題訂閱,因此必須為每個使用的連線設定 ClientID。
perf client 工具預設會為每個消費者建立一個連線,並自動產生 ClientID 和訂閱名稱(符合非共享的持久主題訂閱 API 的要求)。ClientID 仍然需要使用者使用 --clientID <Client ID prefix> 指定 Client ID 前綴,並在測試完成時負責取消訂閱消費者。
完整的指令現在看起來像這樣:
./artemis perf client --warmup 20 --max-pending 100 --show-latency --url tcp://127.0.0.1:61616?confirmationWindowSize=20000 --consumer-url tcp://127.0.0.1:61616 \
--producers 3 --consumers 2 --num-destinations 10 --durable --persistent topic://DURABLE_TOPIC --clientID test_id
# after few seconds
--- warmup false
--- sent:         74842 msg/sec
--- blocked:       2702 msg/sec
--- completed:    74641 msg/sec
--- received:    146412 msg/sec
--- send ack time:   mean:  37366.13 us - 50.00%:  37119.00 us - 90.00%:  46079.00 us - 99.00%:  68095.00 us - 99.90%:  84479.00 us - 99.99%:  94719.00 us - max:     95743.00 us
--- transfer time:   mean:  44060.66 us - 50.00%:  43263.00 us - 90.00%:  54527.00 us - 99.00%:  75775.00 us - 99.90%:  87551.00 us - 99.99%:  91135.00 us - max:     91135.00 us
# CTRL + C
--- SUMMARY
--- result:              success
--- total sent:          2377653
--- total blocked:         80004
--- total completed:     2377653
--- total received:      4755306
--- aggregated send time:       mean:  39423.69 us - 50.00%:  38911.00 us - 90.00%:  49663.00 us - 99.00%:  66047.00 us - 99.90%:  85503.00 us - 99.99%: 101887.00 us - max:    115711.00 us
--- aggregated transfer time:   mean:  46216.99 us - 50.00%:  45311.00 us - 90.00%:  57855.00 us - 99.00%:  78335.00 us - 99.90%:  97791.00 us - 99.99%: 113151.00 us - max:    125439.00 us
結果顯示 tranfer time 沒有排隊,這表示訂閱者能夠跟上生產者的速度:因此,一個合理的測試速率可能是感知到的 sent 速率的約 80%,即 --rate 60000。
./artemis perf client --warmup 20 --max-pending 100 --show-latency --url tcp://127.0.0.1:61616?confirmationWindowSize=20000 --consumer-url tcp://127.0.0.1:61616 \
--producers 3 --consumers 2 --num-destinations 10 --durable --persistent topic://DURABLE_TOPIC --clientID test_id \
--rate 60000
# after many seconds while running
--- warmup false
--- sent:         55211 msg/sec
--- blocked:       2134 msg/sec
--- completed:    54444 msg/sec
--- received:    111622 msg/sec
--- send delay time: mean: 6306710.04 us - 50.00%: 6094847.00 us - 90.00%: 7766015.00 us - 99.00%: 8224767.00 us - 99.90%: 8257535.00 us - 99.99%: 8257535.00 us - max:    8257535.00 us
--- send ack time:   mean:  50072.92 us - 50.00%:  50431.00 us - 90.00%:  57855.00 us - 99.00%:  65023.00 us - 99.90%:  71167.00 us - 99.99%:  71679.00 us - max:     71679.00 us
--- transfer time:   mean:  63672.92 us - 50.00%:  65535.00 us - 90.00%:  78847.00 us - 99.00%:  86015.00 us - 99.90%:  90623.00 us - 99.99%:  93183.00 us - max:     94719.00 us
# it won't get any better :(
send delay time 有什麼問題?+ 結果顯示,負載產生器無法跟上預期的速率,並且在預期的排程負載上累積了巨大的延遲:讓我們嘗試透過增加生產者執行緒來修正這個問題,加入:
--threads <producer threads>透過使用兩個生產者執行緒,指令現在看起來像這樣:
./artemis perf client --warmup 20 --max-pending 100 --show-latency --url tcp://127.0.0.1:61616?confirmationWindowSize=20000 --consumer-url tcp://127.0.0.1:61616 \
--producers 3 --consumers 2 --num-destinations 10 --durable --persistent topic://DURABLE_TOPIC --clientID test_id \
--rate 60000 --threads 2
# after few seconds warming up....
--- warmup false
--- sent:         59894 msg/sec
--- blocked:        694 msg/sec
--- completed:    58925 msg/sec
--- received:    114857 msg/sec
--- send delay time: mean:   3189.96 us - 50.00%:    277.00 us - 90.00%:  10623.00 us - 99.00%:  35583.00 us - 99.90%:  47871.00 us - 99.99%:  56063.00 us - max:     58367.00 us
--- send ack time:   mean:  31500.93 us - 50.00%:  31231.00 us - 90.00%:  48383.00 us - 99.00%:  65535.00 us - 99.90%:  83455.00 us - 99.99%:  95743.00 us - max:     98303.00 us
--- transfer time:   mean:  38151.21 us - 50.00%:  37119.00 us - 90.00%:  55807.00 us - 99.00%:  84479.00 us - 99.90%: 104959.00 us - 99.99%: 118271.00 us - max:    121855.00 us
send delay time 現在看起來受到控制,這表示負載產生器需要一些調整才能發揮最佳效能。